
Snowball Analytics
Best for dividend investorsOur verdict. Snowball Analytics is one of the most complete trackers for dividend investors and anyone with several accounts. It brings stocks, ETFs, real estate and P2P holdings into one view, with honest return figures and strong dividend forecasts. Delayed prices, US dollar billing and a short learning curve are the main compromises.
 Featured partnerSign up to Lightyear and get up to €100 in a free fractional shareCapital at risk, terms apply. Seek guidance if necessary. Claim Up to €100 Capital at risk, terms apply. Seek guidance if necessary.
 - Best for dividend and multi-broker investors. It turns several accounts into one view of value, IRR, income and allocation.
- The free plan is a test, not a home. It allows one portfolio and 10 holdings, which most real portfolios outgrow quickly.
- Starter is the practical paid plan. It adds unlimited holdings, broker linking and dividend ratings for $7.99 a month or $79.99 a year.
- EU broker support is mostly file import. Trading 212, DEGIRO, eToro and Revolut have export guides. Interactive Brokers can also connect directly.
- Try before you pay. Every paid plan has a 14-day free trial without a card, and our link takes 10% off your first payment.
Snowball Analytics is a portfolio and dividend tracker built by Snowball Analytics SAS in Lyon, France. It pulls holdings from several brokers into one dashboard, then adds return calculations, dividend forecasts, benchmarking and risk metrics on top.
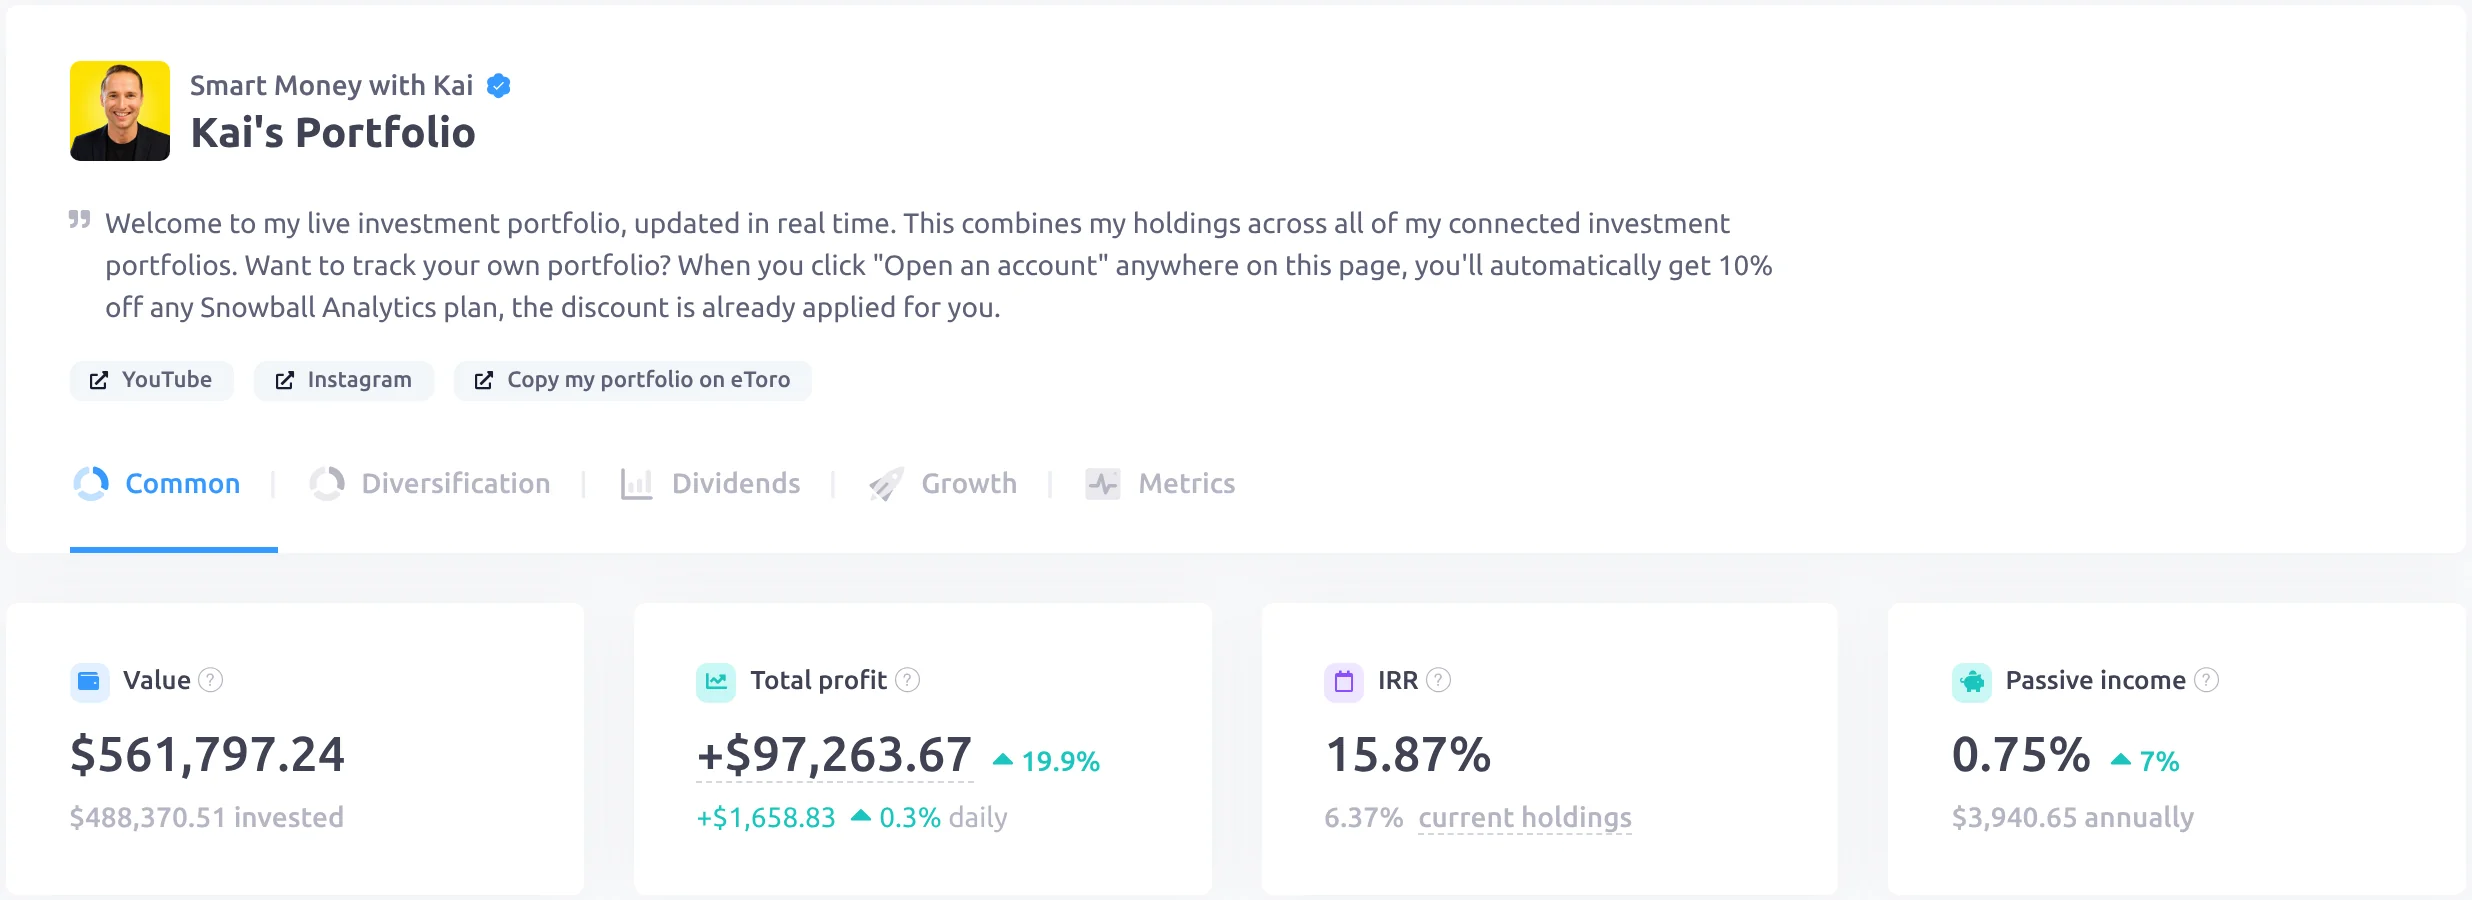
We know it well because Kai, who runs EU Investing Hub, uses the Expert plan to track his own investments across several brokers. He publishes the combined result as a public Snowball portfolio, which is where most of the screenshots in this review come from. The amounts shown are his real figures on 11 October 2026.
Why I use Snowball Analytics
I use Snowball Analytics to track all my assets in one view. That is not only stocks and ETFs, but also my real estate and P2P holdings, which sit in the same dashboard as my broker accounts. You can see the result in my public portfolio.
Many brokers can sync automatically. If you would rather not connect an account, you can import your broker statements manually instead. The interface takes a little while to get used to, but once you know your way around, it is quite powerful.
The mobile app is really nice, and my family and I all use it. On iPhone, the home screen widgets show upcoming dividend payments at a glance. Snowball's own changelog lists widgets for iOS only, so I cannot confirm them for Android yet.
It is especially good for dividend investors. One thing to keep in mind is that prices are not real time. Snowball says quotes update about every 30 minutes, so values can lag the market slightly.
For what it does, I think the pricing is great value. I use the Expert plan myself.
Kai Schukowski, founder of EU Investing Hub
Our verdict on Snowball Analytics
We rate Snowball Analytics 4.8 out of 5. It is one of the most complete trackers for investors who care about dividends and want honest performance numbers across several accounts. The dividend workflow, IRR and benchmark comparison are the standout features, and the interface stays readable even with dozens of holdings.
The limits are practical. The free plan stops at 10 holdings, prices are billed in US dollars, quotes are delayed, and most European brokers rely on file imports rather than live connections. Check that your broker imports cleanly before you pay.
What we like, and what to watch
- Tracks more than stocks. Real estate, P2P loans, deposits and other custom assets sit next to your broker accounts.
- Strong dividend workflow. Yield, yield on cost, received payouts, a 12-month forecast and dividend growth sit in one place.
- Clear performance figures. IRR, time-weighted return, benchmarking, beta, Sharpe and Sortino ratios are calculated for you.
- One view across brokers. File imports, direct connections and manual entries can feed one combined portfolio.
- Low-risk way to test. A permanent free plan plus a 14-day trial of paid features with no card required.
- Tight free plan. One portfolio and 10 holdings, with limited benchmarking and rebalancing.
- Priced in US dollars. Plans are billed in USD, so your card provider may add a conversion fee.
- Uneven EU broker coverage. We found no dedicated help guide for Lightyear, Trade Republic or Scalable Capital.
- Prices are not real time. Snowball says quotes update about every 30 minutes, and linked accounts sync once a day.
- Takes time to learn. There are many tabs and settings, so expect a short learning curve before it feels natural.
Pricing and plans
We checked the official pricing page on 11 October 2026. There are four plans. Annual billing saves about 16%, which Snowball describes as two months free.
- 1 portfolio, 10 holdings
- Dividend calendar
- Broker report import
- Limited benchmarking
- Unlimited holdings
- Broker linking
- Full rebalancing tool
- Dividend rating
- 10 portfolios
- Benchmark against any asset
- Portfolio report, Why is it moving
- 30+ years of backtests
- Unlimited portfolios
- MCP access for AI apps
- 20 watchlists
- Everything in Investor
Official prices, checked 11 October 2026. Snowball bills in US dollars only.
Checked on snowball-analytics.com on 11 October 2026.
For most investors the choice is between Free and Starter. Free is fine for a small ETF portfolio of up to 10 holdings. Starter removes the holdings cap and adds broker linking, the full rebalancing tool and dividend ratings. Investor makes sense when you run separate portfolios, for example a pension and a taxable account, or want 30+ years of backtest data. Expert removes the portfolio limit and adds MCP access, which lets AI apps such as Claude read your portfolio data.
We looked for euro pricing on the pricing page, with European language and location settings and in the pricing data the page loads. Every route returned US dollars, and the page states that all prices are in USD. Your bank converts the payment, so check your card's currency fee.
During the trial you get full access, except that you can create only two portfolios. When it ends, Snowball moves you to the Free plan and asks you to upgrade or remove data if you exceed its limits. It says it never deletes data without your permission. Payments run through Stripe, and you can cancel at any time.
The discount works through Snowball's referral programme. Its terms say users who register through a referral link get 10% off their first purchase. Our link opens Snowball with Kai's referral code already attached, and the code is passed into the registration form, so there is nothing to type. It applies once, to your first payment, whether you choose monthly or annual billing. Annual billing gives the bigger saving, since the 10% comes off a full year.
OverviewDashboard and portfolio analytics
The dashboard opens with four numbers: current value against invested capital, total profit, IRR and passive income. IRR is the useful one. It accounts for when you added money, so it shows your real annual return rather than a simple gain percentage that ignores deposit timing. The compound growth calculator is a separate way to sketch regular contributions before you import a real account.
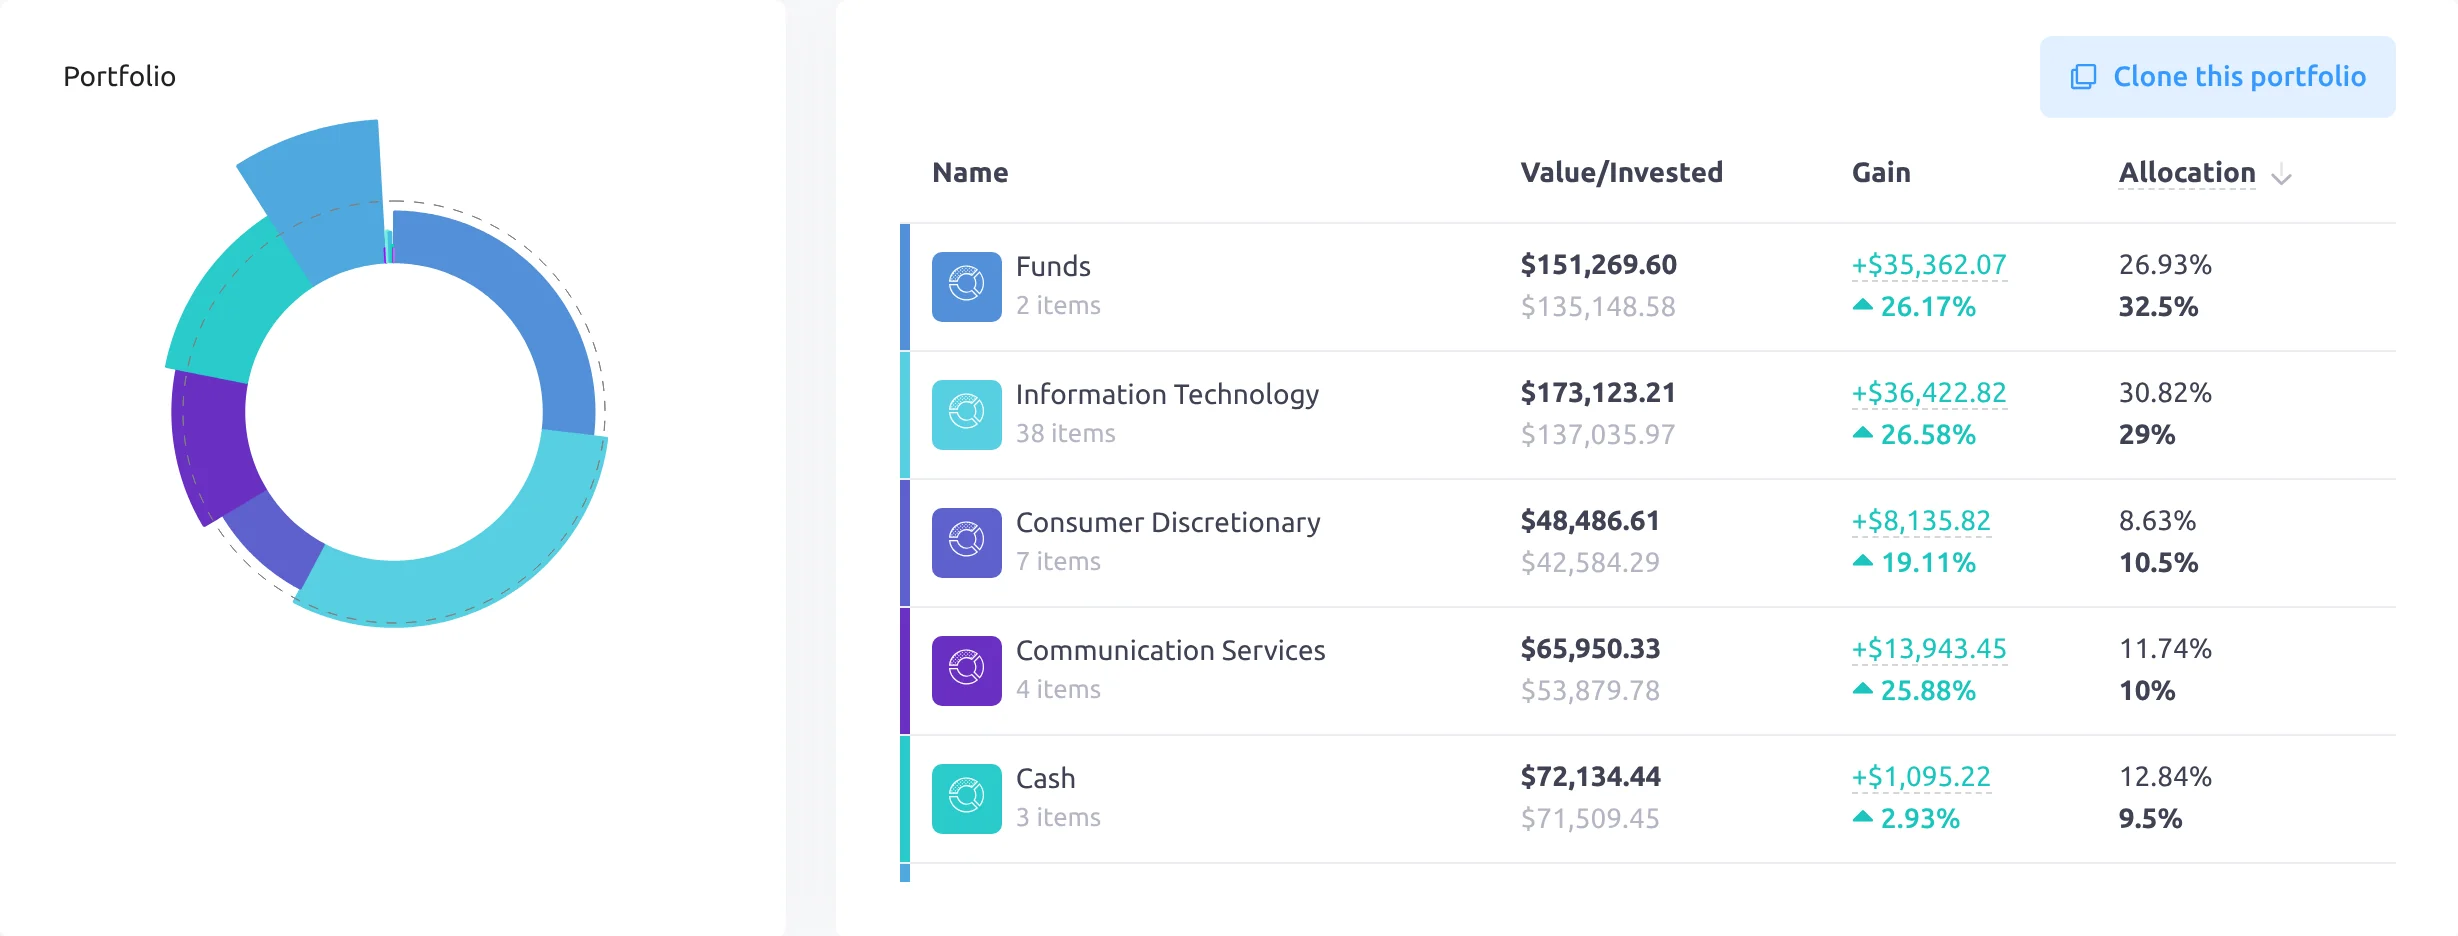
Below the headline numbers, the portfolio splits into categories. By default these follow sectors and fund types, but you can set your own categories and target weights. That is what drives the rebalancing tool: Snowball compares current weights with your targets and suggests where new money should go.
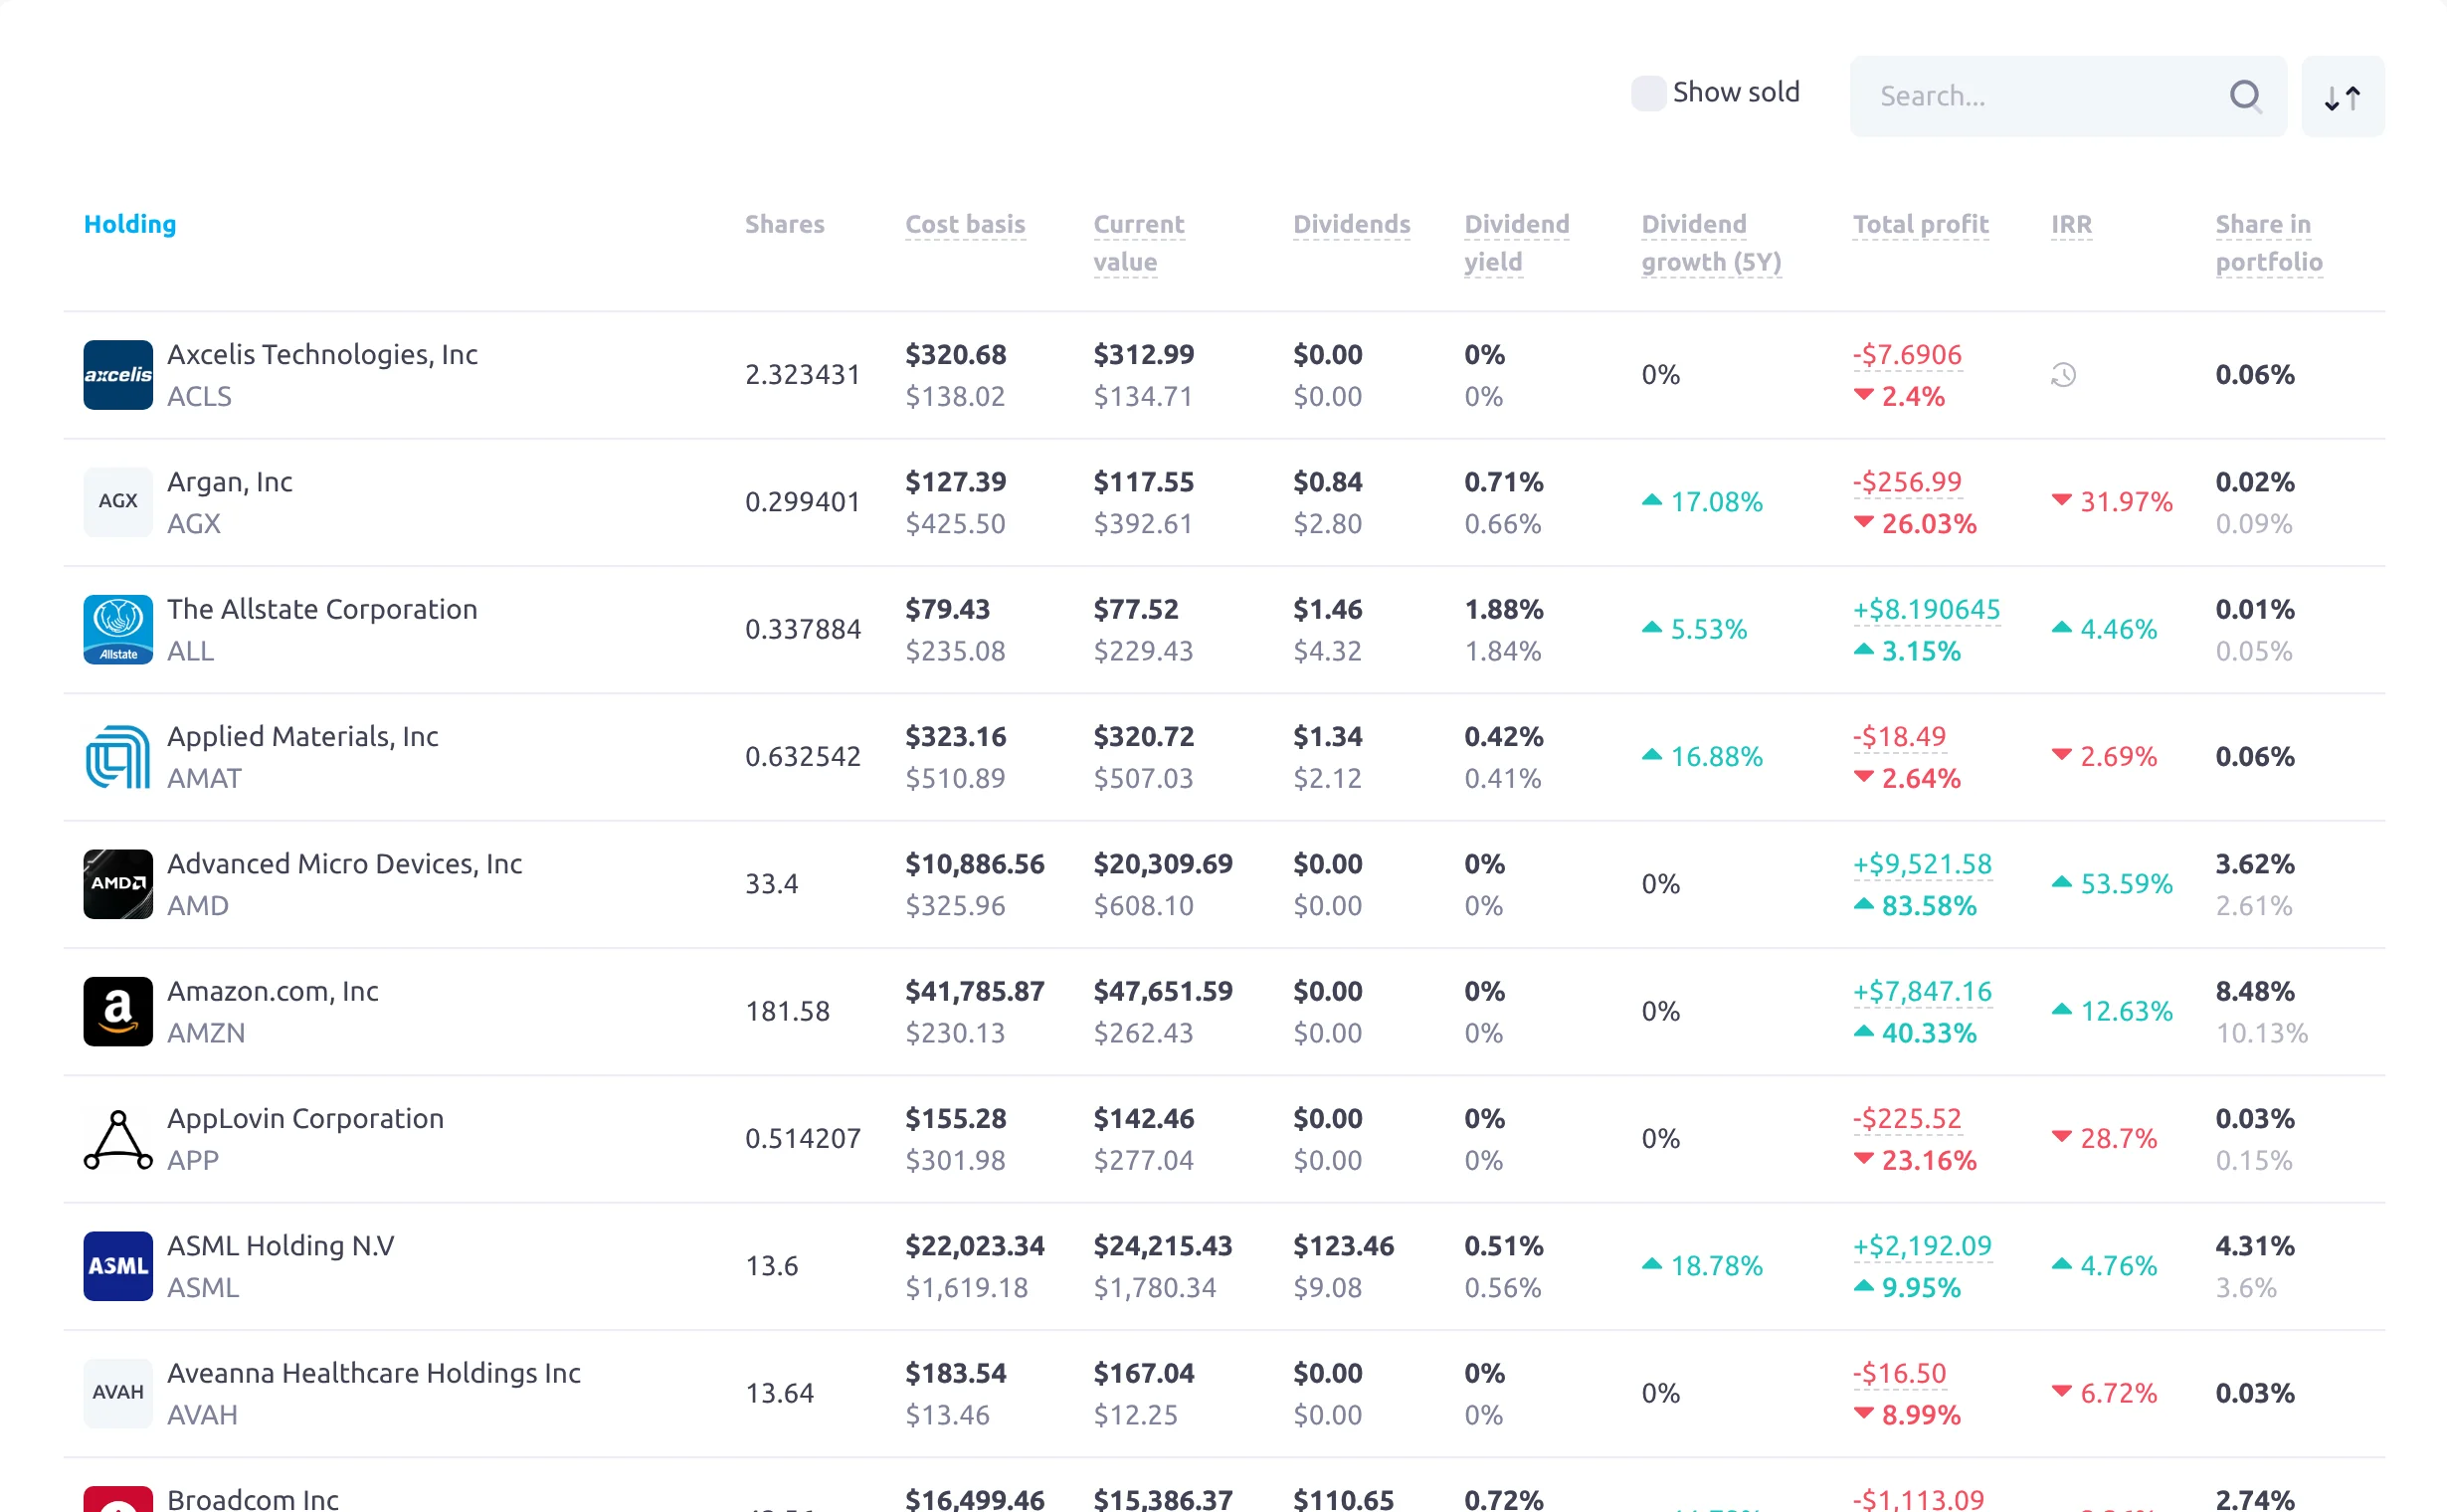
The holdings table lists every position with cost basis, current value, dividend yield, five-year dividend growth, total profit, IRR and portfolio share. Other tabs cover transactions, goal tracking, cash balances by currency and corporate actions such as splits. A stealth mode hides every amount on screen, which is handy if you check your portfolio in public.
Dividend tracking
Dividends are where Snowball stands out. It tracks received payouts automatically, calculates yield and yield on cost, and lets you set a custom withholding tax. That last point matters for European investors, who often lose 15% or more of US dividends to withholding tax before the cash arrives. For the UCITS dividend funds Europeans can buy instead of US-listed ETFs, our SCHD alternatives guide compares the main options.
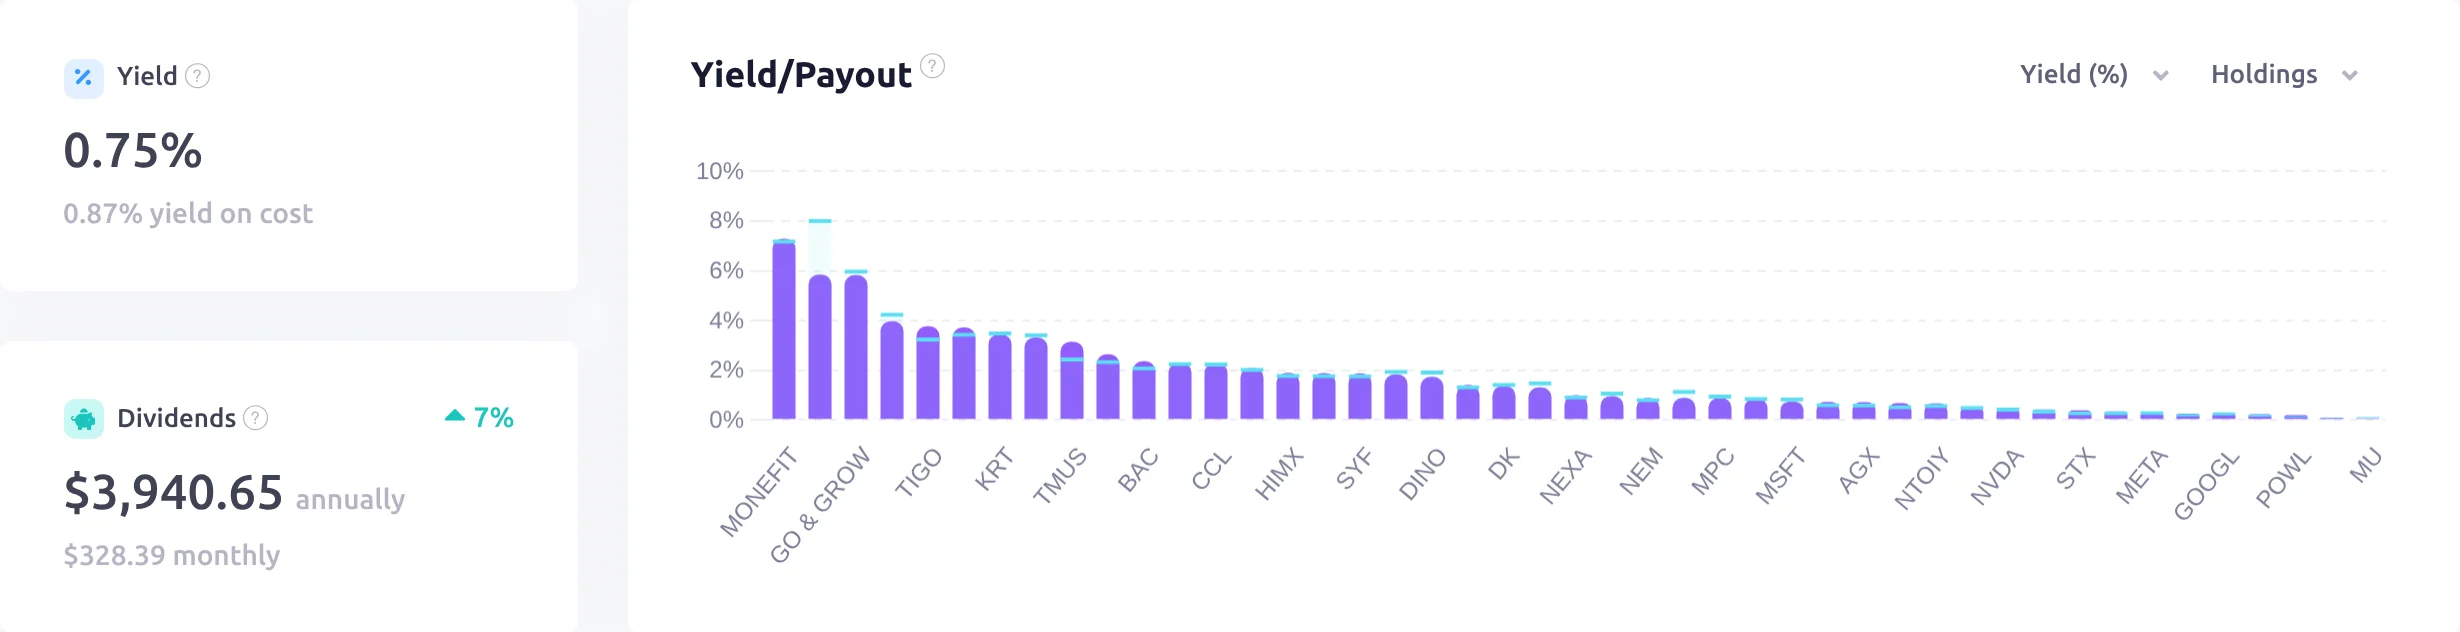
Go & Grow appears in that yield ranking next to the stock and ETF holdings. The product itself is covered in our Go & Grow review.
The forecast view projects payouts for the next 12 months, month by month. Next to it, average annual growth shows which holdings have raised their payouts fastest. Starter and above add a dividend rating that scores the financial strength behind each payout.
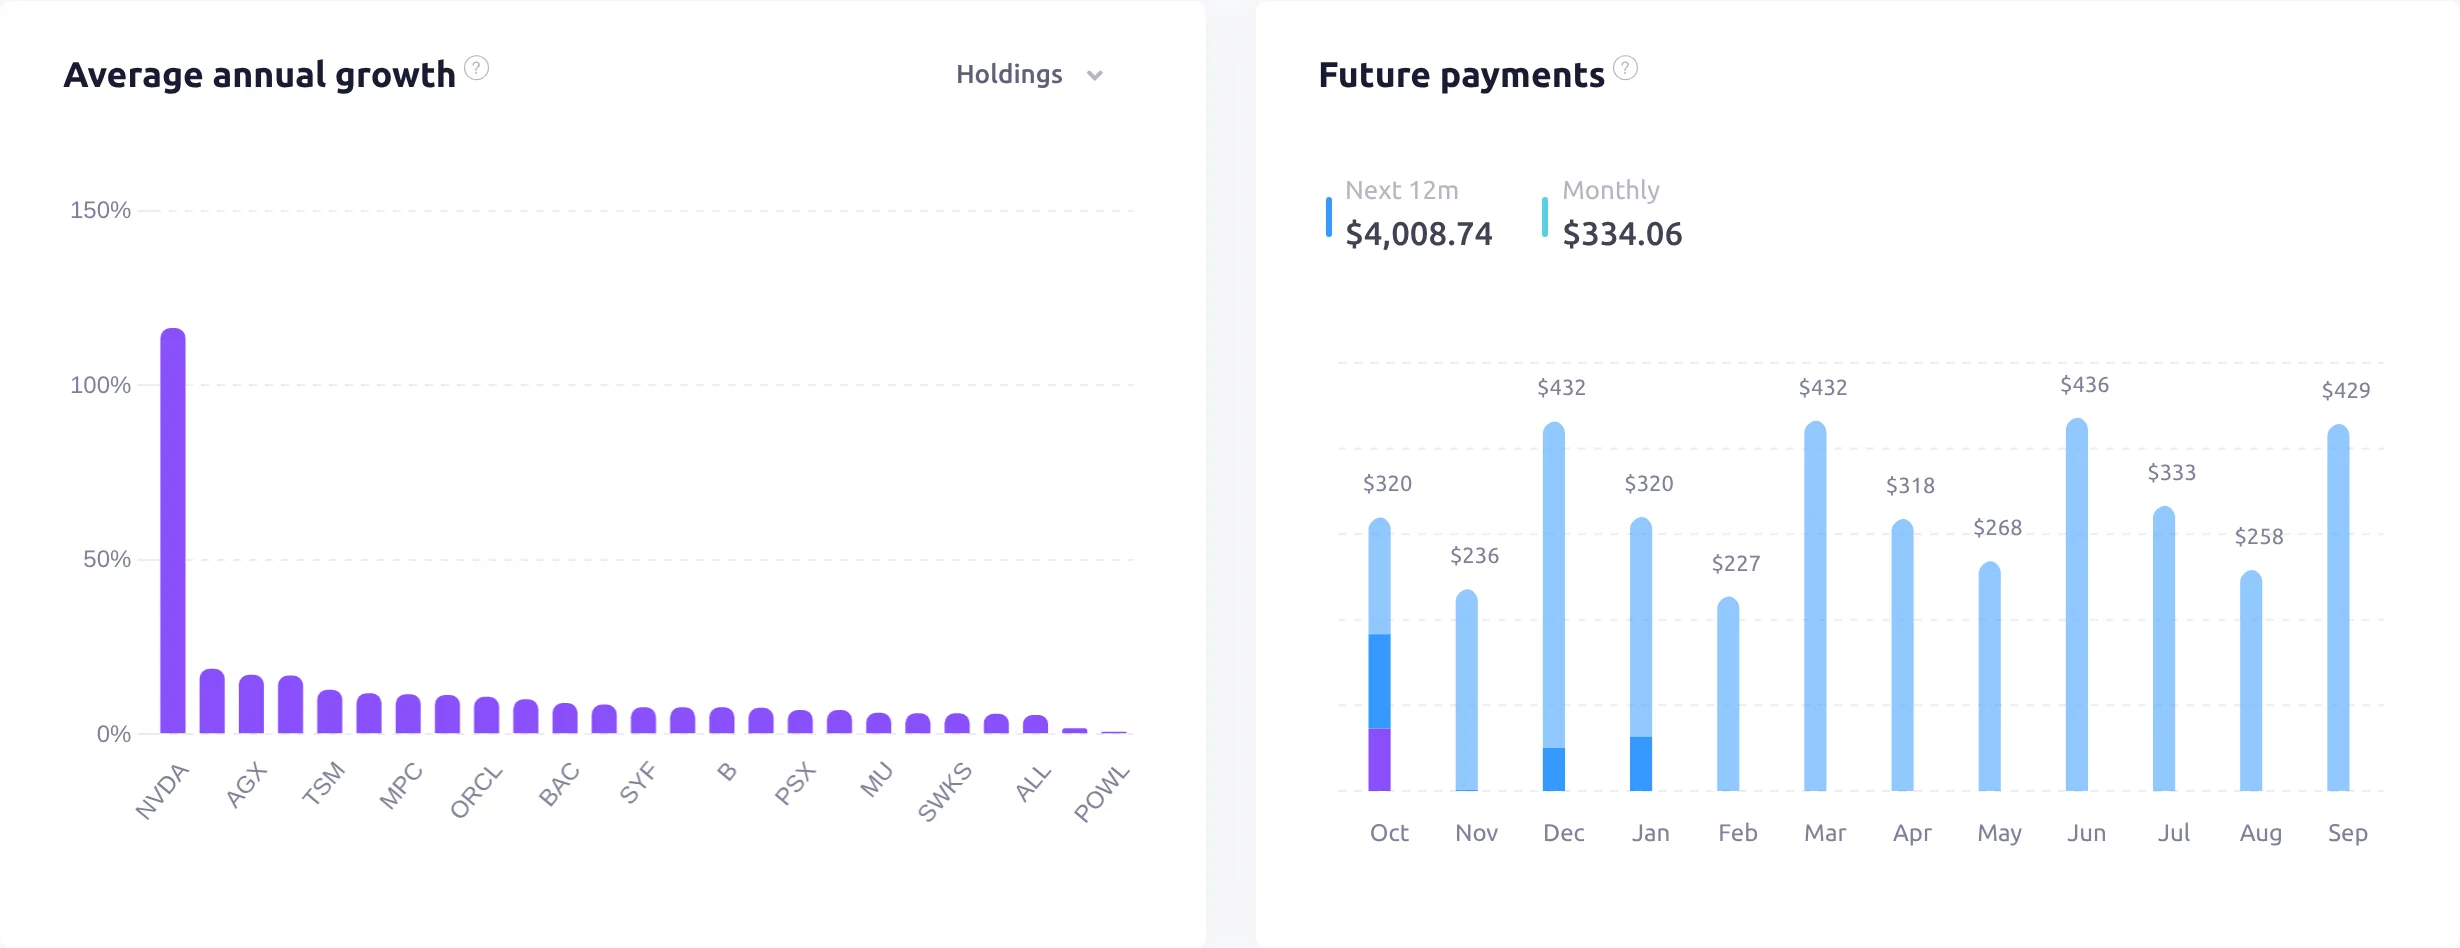
Forecasts are estimates. Companies can cut or delay dividends, and exchange rates move. Use the forecast to plan, not to count on a fixed income.
ReturnsPerformance, benchmarks and risk metrics
The growth tab compares your portfolio with a benchmark over periods from seven days to all time. Free and Starter benchmark against index funds such as the S&P 500. Investor and Expert can compare against any asset. A monthly returns chart shows which months helped or hurt.
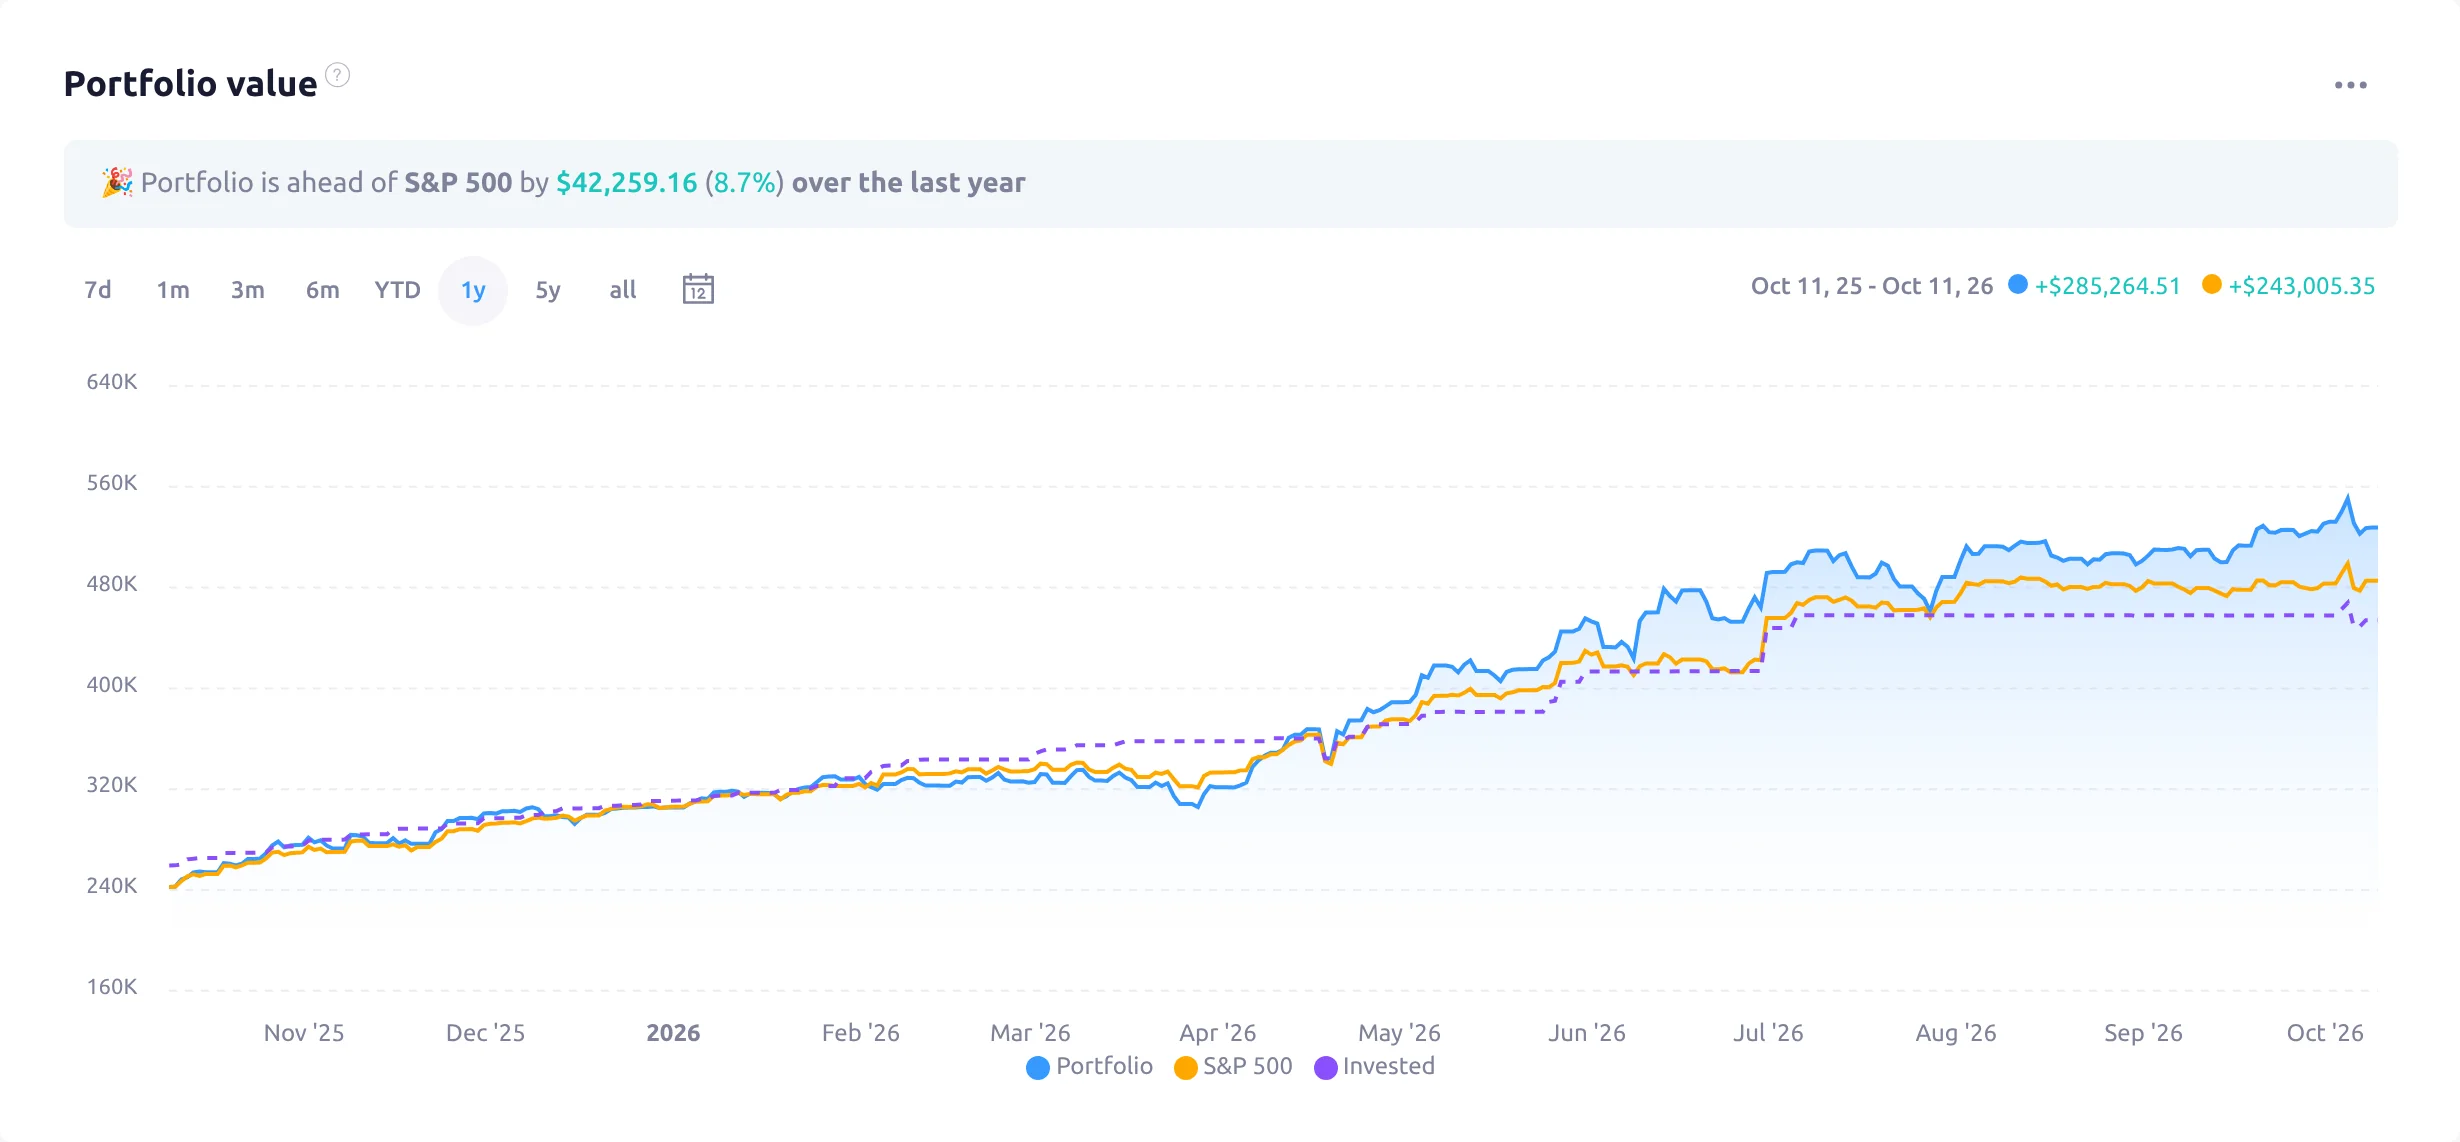
The metrics tab adds time-weighted return, portfolio P/E, beta, and Sharpe and Sortino ratios, each with a plain explanation. Time-weighted return strips out the effect of deposits, so it is the fairer figure for comparing against a fund or index.
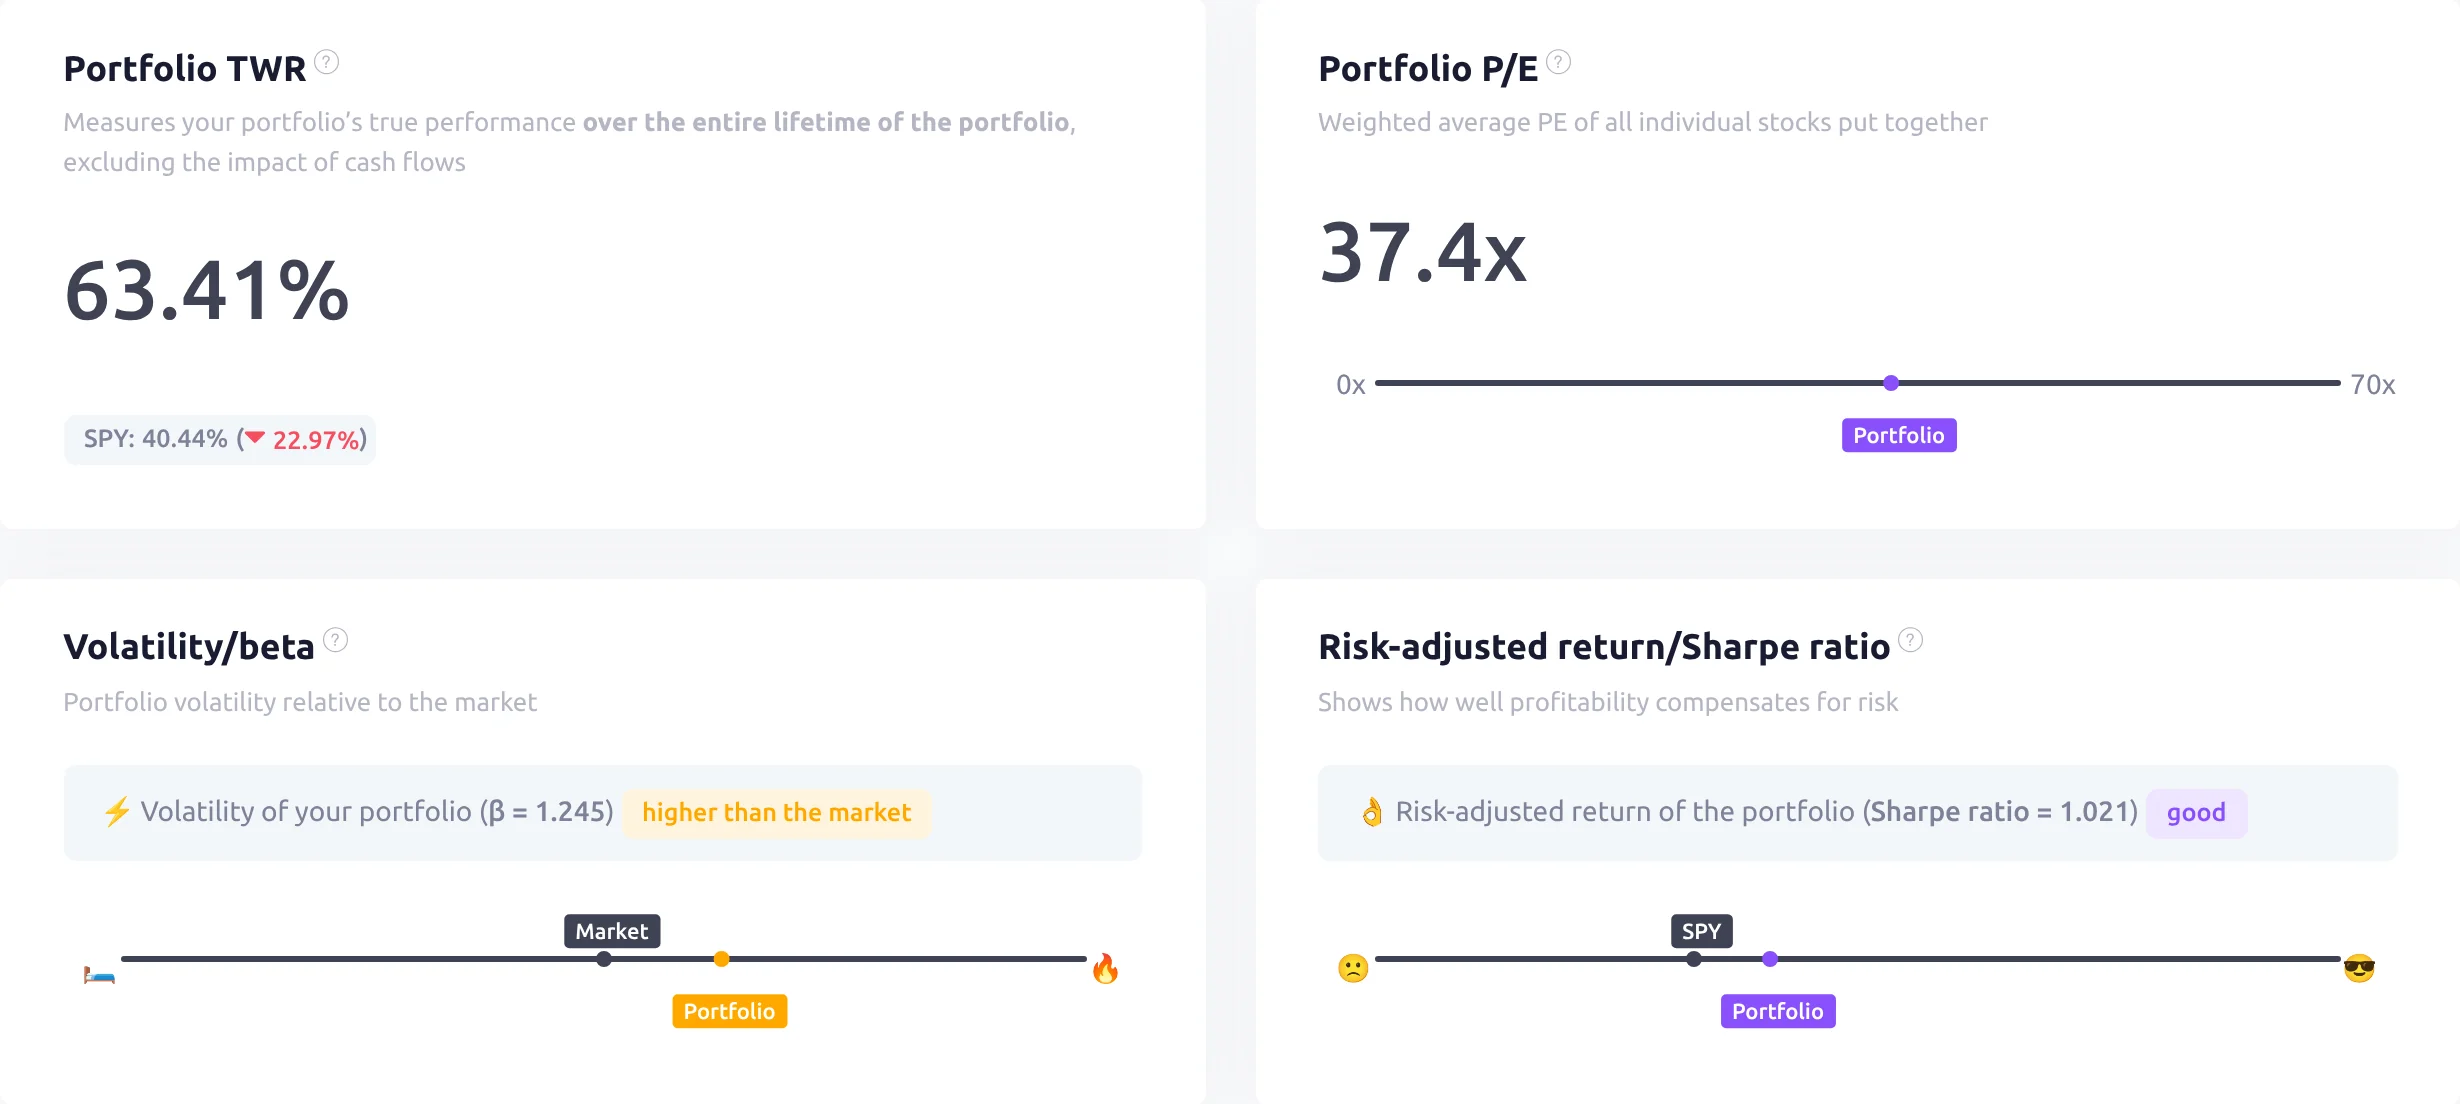
Investor and Expert also include a portfolio report you can export and a "Why is it moving" feature for checking what is behind price moves in your holdings.
ConnectionsWhich EU brokers work with Snowball Analytics?
Snowball supports two routes. Broker linking, from Starter upwards, uses the Yodlee and SnapTrade data services, and Snowball says it covers more than 1,000 brokers. Report import, available on every plan, reads the CSV or Excel files your broker lets you download.
For the brokers European investors use most, the Snowball help centre showed this on 11 October 2026:
- Interactive Brokers: direct connection through Yodlee with a query ID and token, or CSV activity statement import.
- Trading 212: CSV export from the History section, up to one calendar year per file.
- DEGIRO: CSV export of your transactions from the inbox section.
- eToro: account statement export in XLS format.
- Revolut: account statement export in Excel format.
- XTB, Saxo and Nordnet: report export guides are available.
- Lightyear, Trade Republic and Scalable Capital: we found no dedicated guide. Check the broker list in the app's import dialog, or use Snowball's own CSV template.
File imports need upkeep. After the first import, you upload a new statement from the date of your last import. Linked accounts sync daily, but Yodlee itself updates every few days and SnapTrade runs a day behind, so recent trades can take time to appear.
Tools, AI and community
Beyond tracking, Snowball includes several research tools:
- Top dividend stocks: a screener that shows 5 stocks on Free, 20 on Starter and 50 on Investor and Expert.
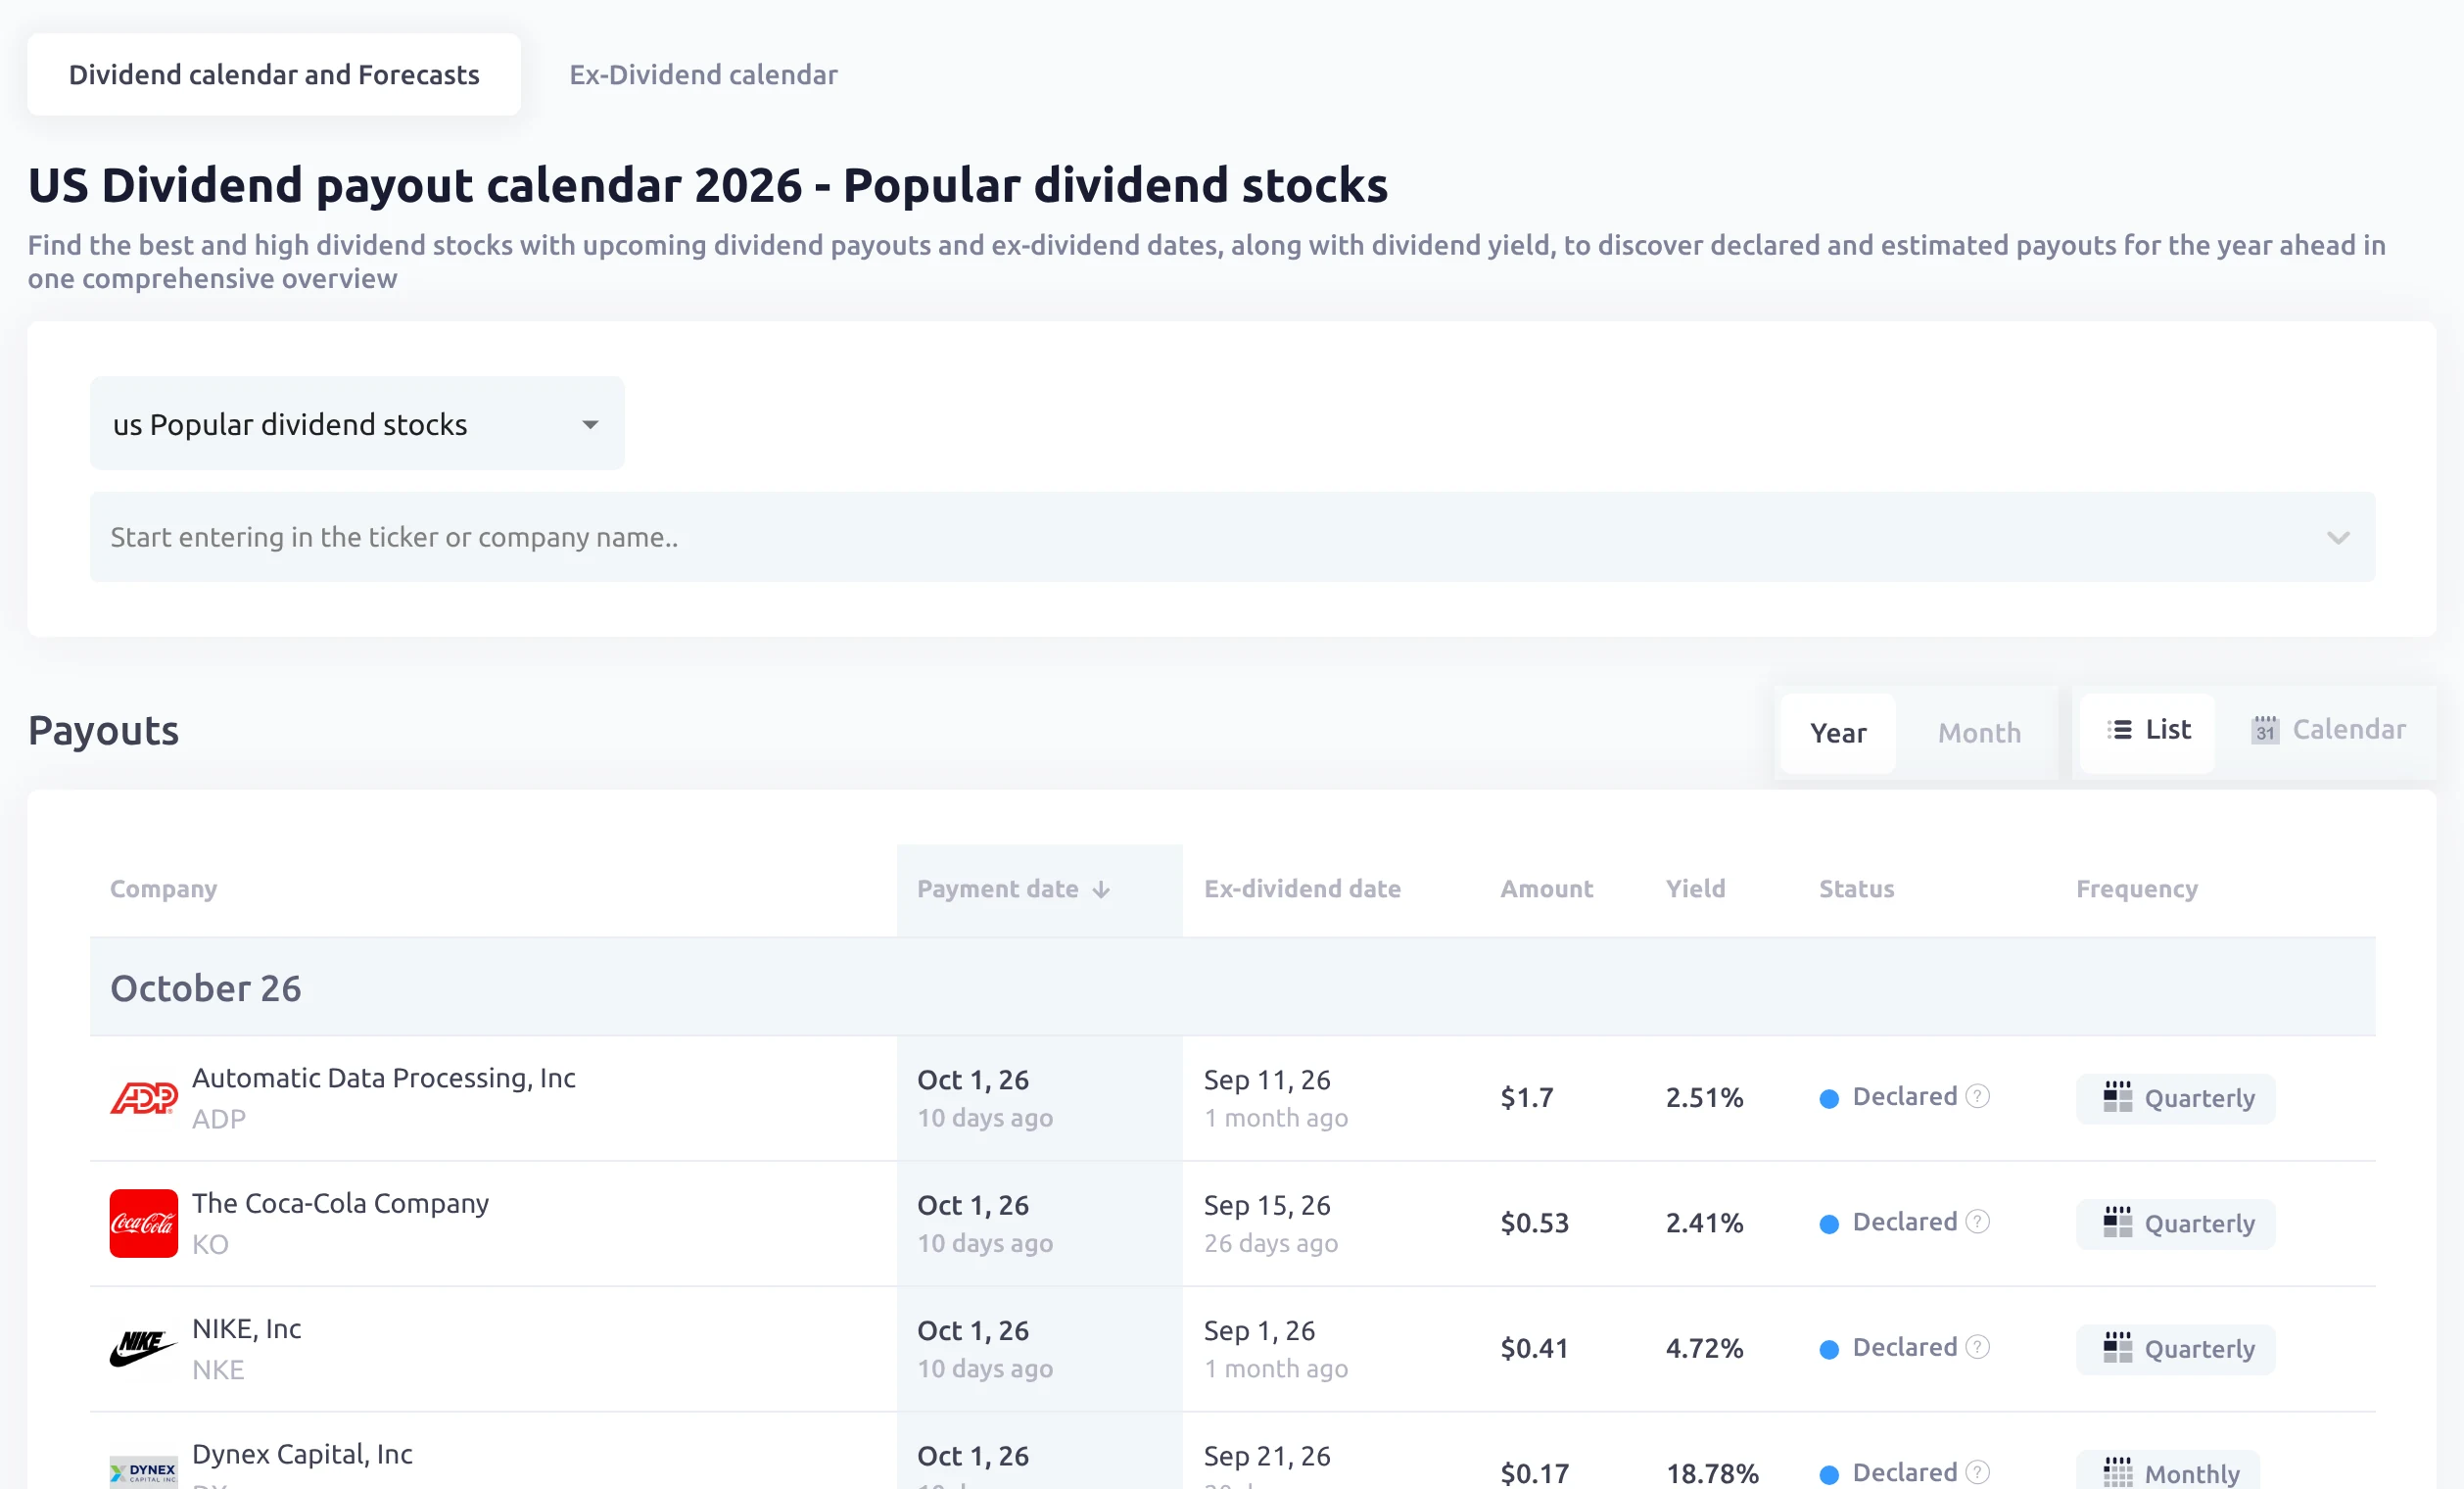
- Dividend payout calendar: upcoming payment and ex-dividend dates for popular stocks, free to view without an account.
- Portfolio Lab: a beta tool to calculate dividend income for a planned portfolio and backtest it against a benchmark.
- Find the Dip: an idea-finding tool in the Tools menu, included on every plan.
- Ask Snowball Analytics: an AI assistant that answers questions about your own portfolio. Expert users can also connect the portfolio to outside AI apps through MCP.
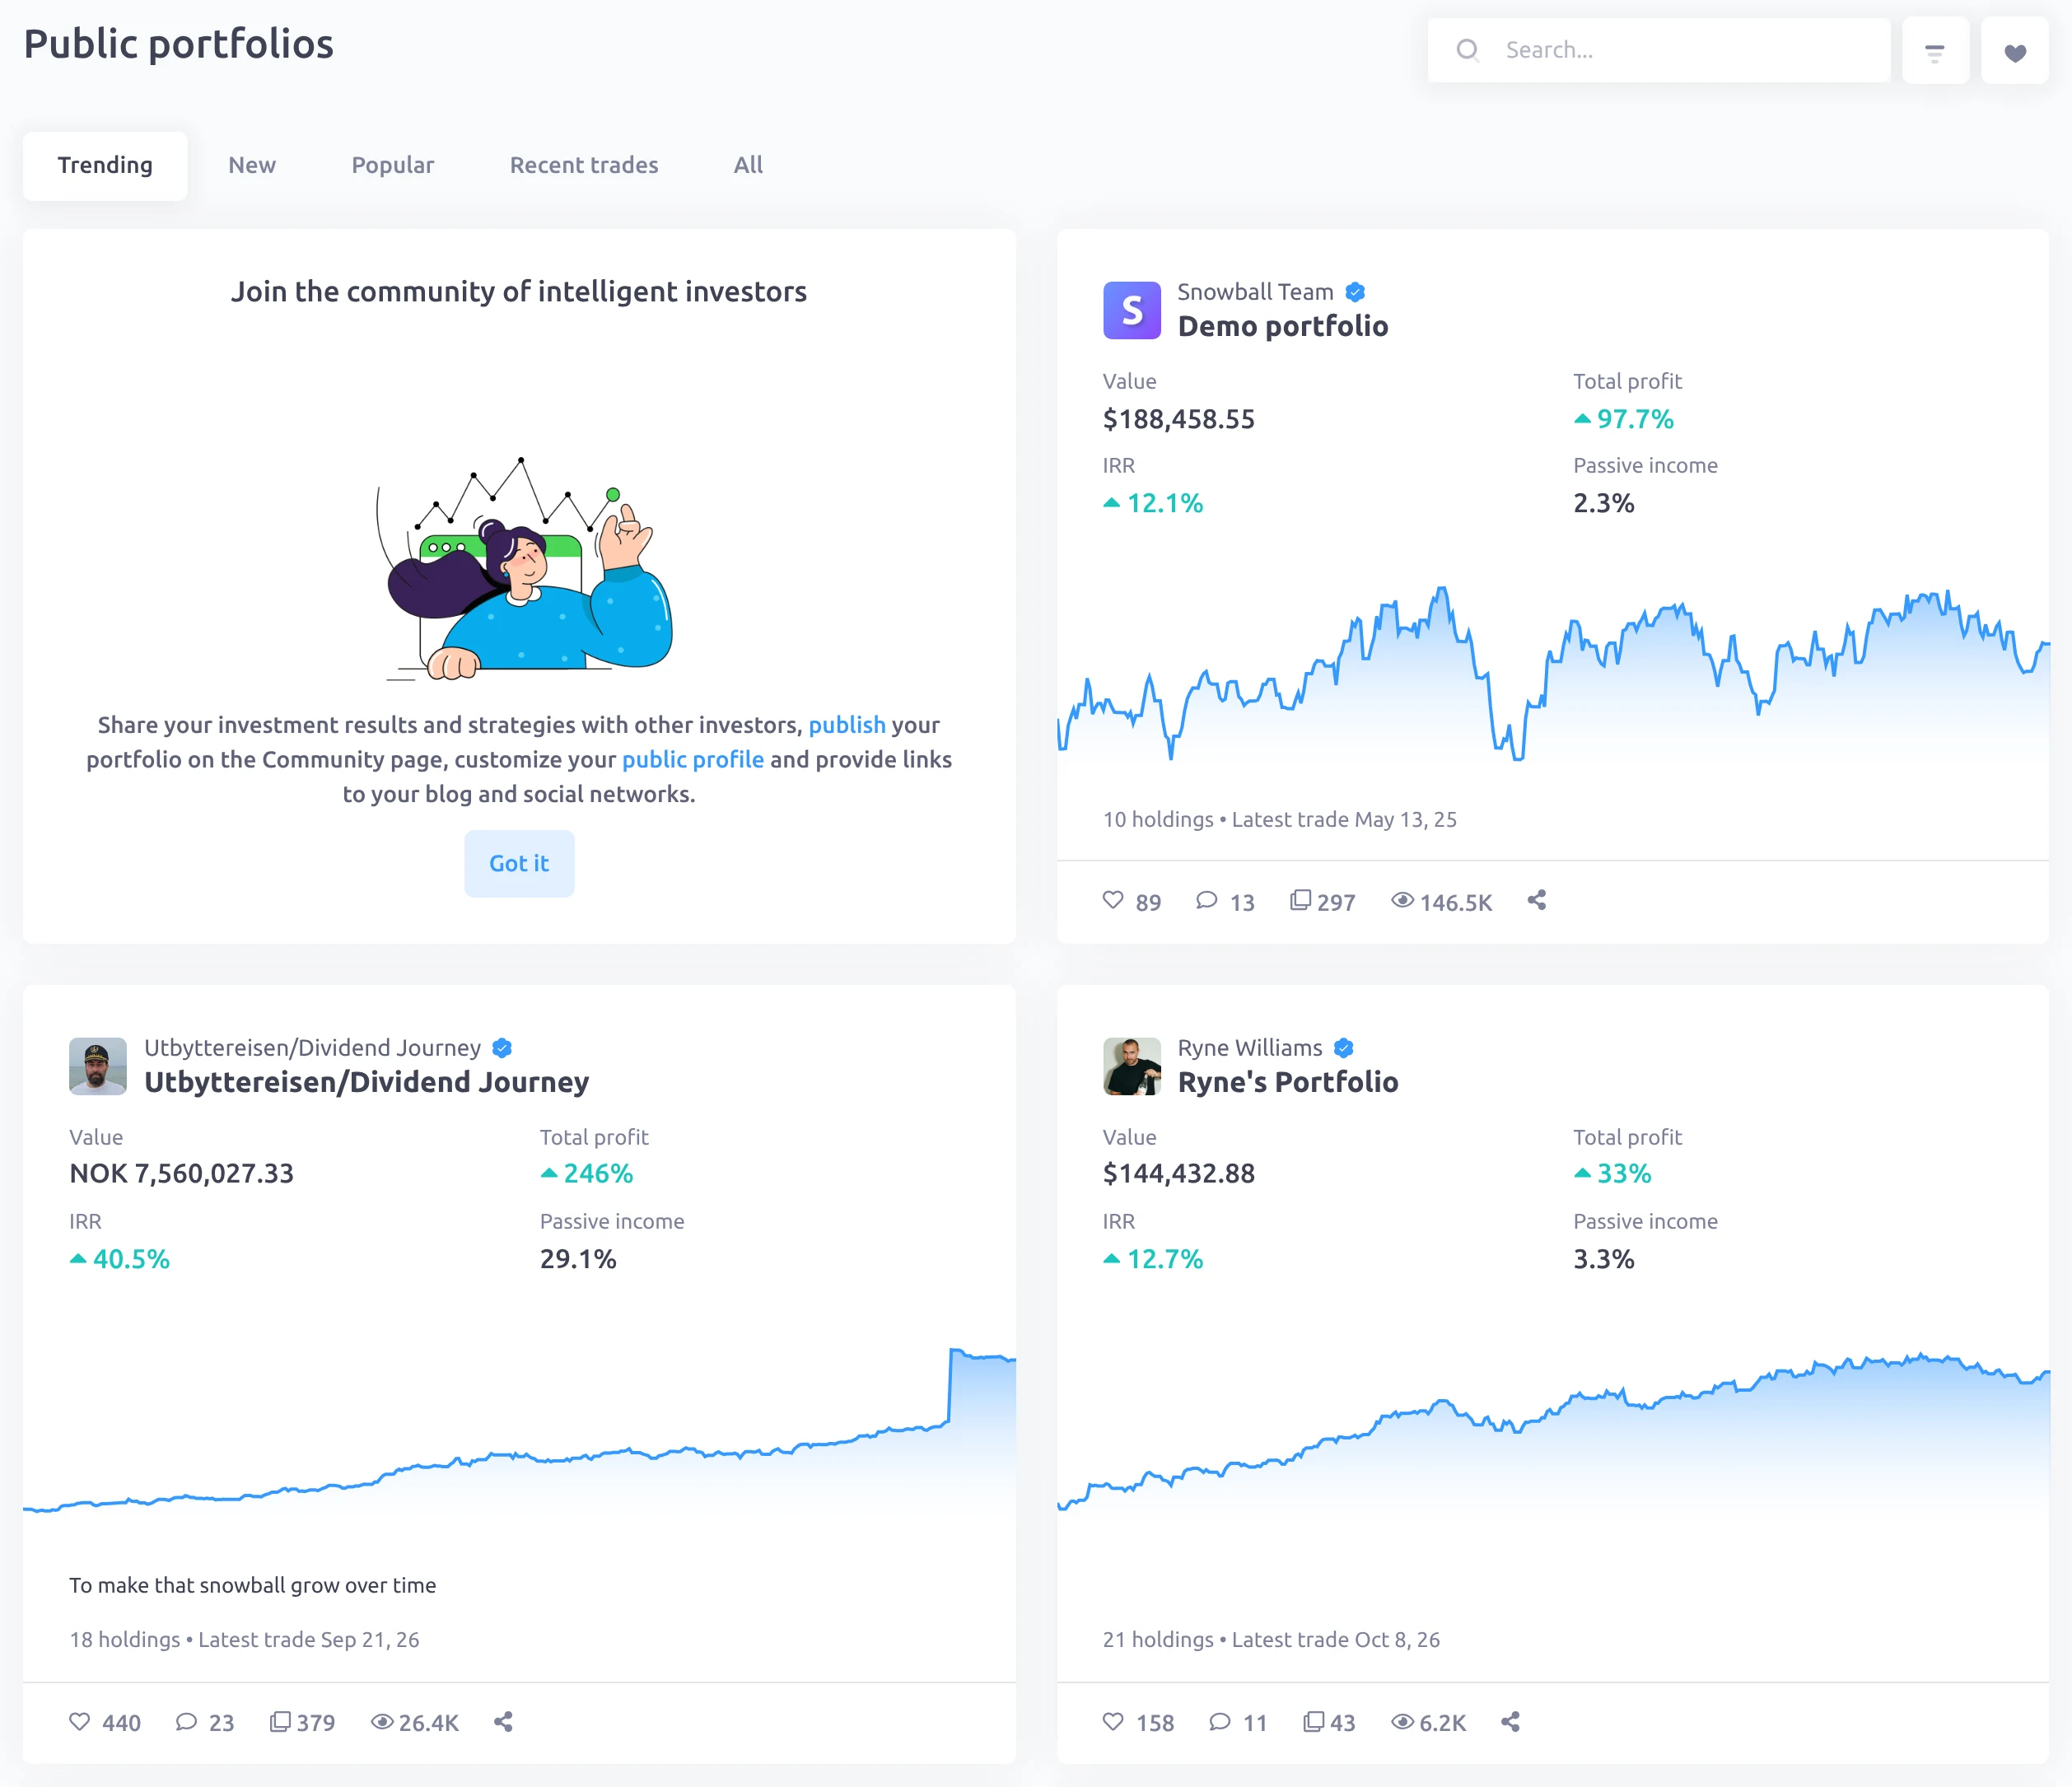
The community section lets investors publish their portfolios, browse others and clone their target allocations. It is useful for ideas, but a strong recent return on someone else's portfolio is not a reason to copy it.
Security and data
Snowball Analytics SAS is registered in Lyon, France, so your data sits with an EU company subject to GDPR. Snowball says it does not store your broker login credentials, and that user data is depersonalised and encrypted at rest. Market data comes from EODHD, and broker connections run through SnapTrade and Yodlee.
Snowball is a tracker, not a broker. It cannot place trades or move money, and it carries its own disclaimer that its data is not necessarily real time or accurate. Check important figures against your broker.
ComparisonSnowball Analytics vs getquin
Both trackers combine several accounts into one view, but they lean in different directions. Snowball goes deeper on dividends, risk metrics and benchmarking. getquin is a Berlin-based app priced in euros, with a broader net-worth view and a social feed.
If income investing is central to your strategy, Snowball is the stronger fit. If you mainly want a convenient overview of everything you own, getquin may be simpler. Our best investing tools guide compares both with free options such as Portfolio Performance.
Best fitWho Snowball Analytics suits
A good fit: dividend investors, anyone holding more than one broker account, and investors who want IRR and benchmark comparisons without building a spreadsheet.
A weaker fit: investors with a single ETF and no interest in dividends, who can stay on the free plan or use their broker's own app. It is also harder work if your main broker has no import guide.
Try Snowball Analytics with 10% off
Frequently asked questions
Yes. The Free plan costs $0 and allows one portfolio with up to 10 holdings, a dividend calendar, broker report imports and limited benchmarking and rebalancing. Paid plans start at $7.99 a month.
On 11 October 2026 the plans were Starter at $7.99 a month or $79.99 a year, Investor at $14.99 a month or $149.99 a year, and Expert at $24.99 a month or $249.99 a year. Annual billing saves about 16%. Prices are in US dollars.
Yes. If you register through our link, you get 10% off your first payment, on any paid plan, monthly or annual. The link adds the referral code to your sign-up automatically, so you do not need to type a code. Renewals are charged at the normal price. You can still start with the 14-day free trial first.
No. On 11 October 2026 Snowball showed prices only in US dollars, with the note that all prices are in USD, and we found no euro option on the pricing page or in its pricing data. Your bank or card provider converts the payment and may add a fee.
No. Snowball says quotes update roughly every 30 minutes, with each asset on its own timer. Linked broker accounts sync once a day. It is built for tracking, not for timing trades.
Yes, on iPhone. Snowball added home screen widgets to its iOS app in April 2025, showing upcoming payouts and portfolio performance. There is also an Android app, but Snowball's own changelog lists widgets for iOS only, so we could not confirm them on Android.
Yes, through file import. Snowball's help centre explains how to export a CSV from the Trading 212 History section and upload it. Trading 212 exports cover up to one calendar year per file, so longer histories need several files.
Yes. Snowball documents a direct connection through Yodlee using a query ID and token from IBKR's third-party reports settings. You can also import IBKR activity statements as CSV files.
Snowball says it does not store your broker login credentials and that user data is depersonalised and encrypted at rest. The company is Snowball Analytics SAS, registered in Lyon, France. As with any tracker, upload only the data you need.
Snowball says your account moves to the Free plan automatically. If you exceed the free limits, you are asked to upgrade or remove portfolios or holdings. No card is needed to start the trial.
Choose Snowball Analytics if dividend detail, risk metrics and benchmarking matter most. Choose getquin if you want a euro-priced app with a wide set of European account connections. Test one real account in either before you pay.
Risk disclaimer: Snowball Analytics is a portfolio tracking tool, not a broker or investment adviser. Its data, forecasts and AI output can be inaccurate. Past performance does not predict future returns. Pricing and features were checked on snowball-analytics.com and its help centre on 11 October 2026 and can change.
Featured partner: Capital at risk. Provider of the investment services is Lightyear Europe AS for the EU. Terms apply: lightyear.com/terms. Seek qualified advice if necessary. This is not investment advice. Sponsored Link.